Indoor air quality affects your health more than you might realize. Creating your own air monitor empowers you to track pollutants and breathe cleaner air every day! ✨
Why Indoor Air Quality Matters More Than Ever 🏠
We spend approximately 90% of our time indoors, yet indoor air can be two to five times more polluted than outdoor air. This startling reality makes monitoring your home’s air quality essential for protecting your family’s health and wellbeing.
Common indoor pollutants include volatile organic compounds (VOCs) from cleaning products, particulate matter from cooking, carbon dioxide from breathing, and allergens like dust mites and pet dander. These invisible threats can trigger asthma, allergies, headaches, and long-term respiratory issues.
Commercial air quality monitors cost anywhere from $100 to $300, but building your own device offers flexibility, customization, and significant cost savings. You’ll gain hands-on knowledge about what affects your air quality while creating a solution tailored to your specific needs.
Understanding What You’re Measuring 🔬
Before diving into construction, understanding the key air quality metrics helps you choose the right sensors and interpret your data effectively.
Particulate Matter (PM2.5 and PM10)
Particulate matter refers to tiny particles suspended in the air. PM2.5 particles measure 2.5 micrometers or smaller and penetrate deep into your lungs and bloodstream. PM10 particles are slightly larger but still harmful. Sources include cooking smoke, candles, fireplaces, and outdoor pollution entering through windows.
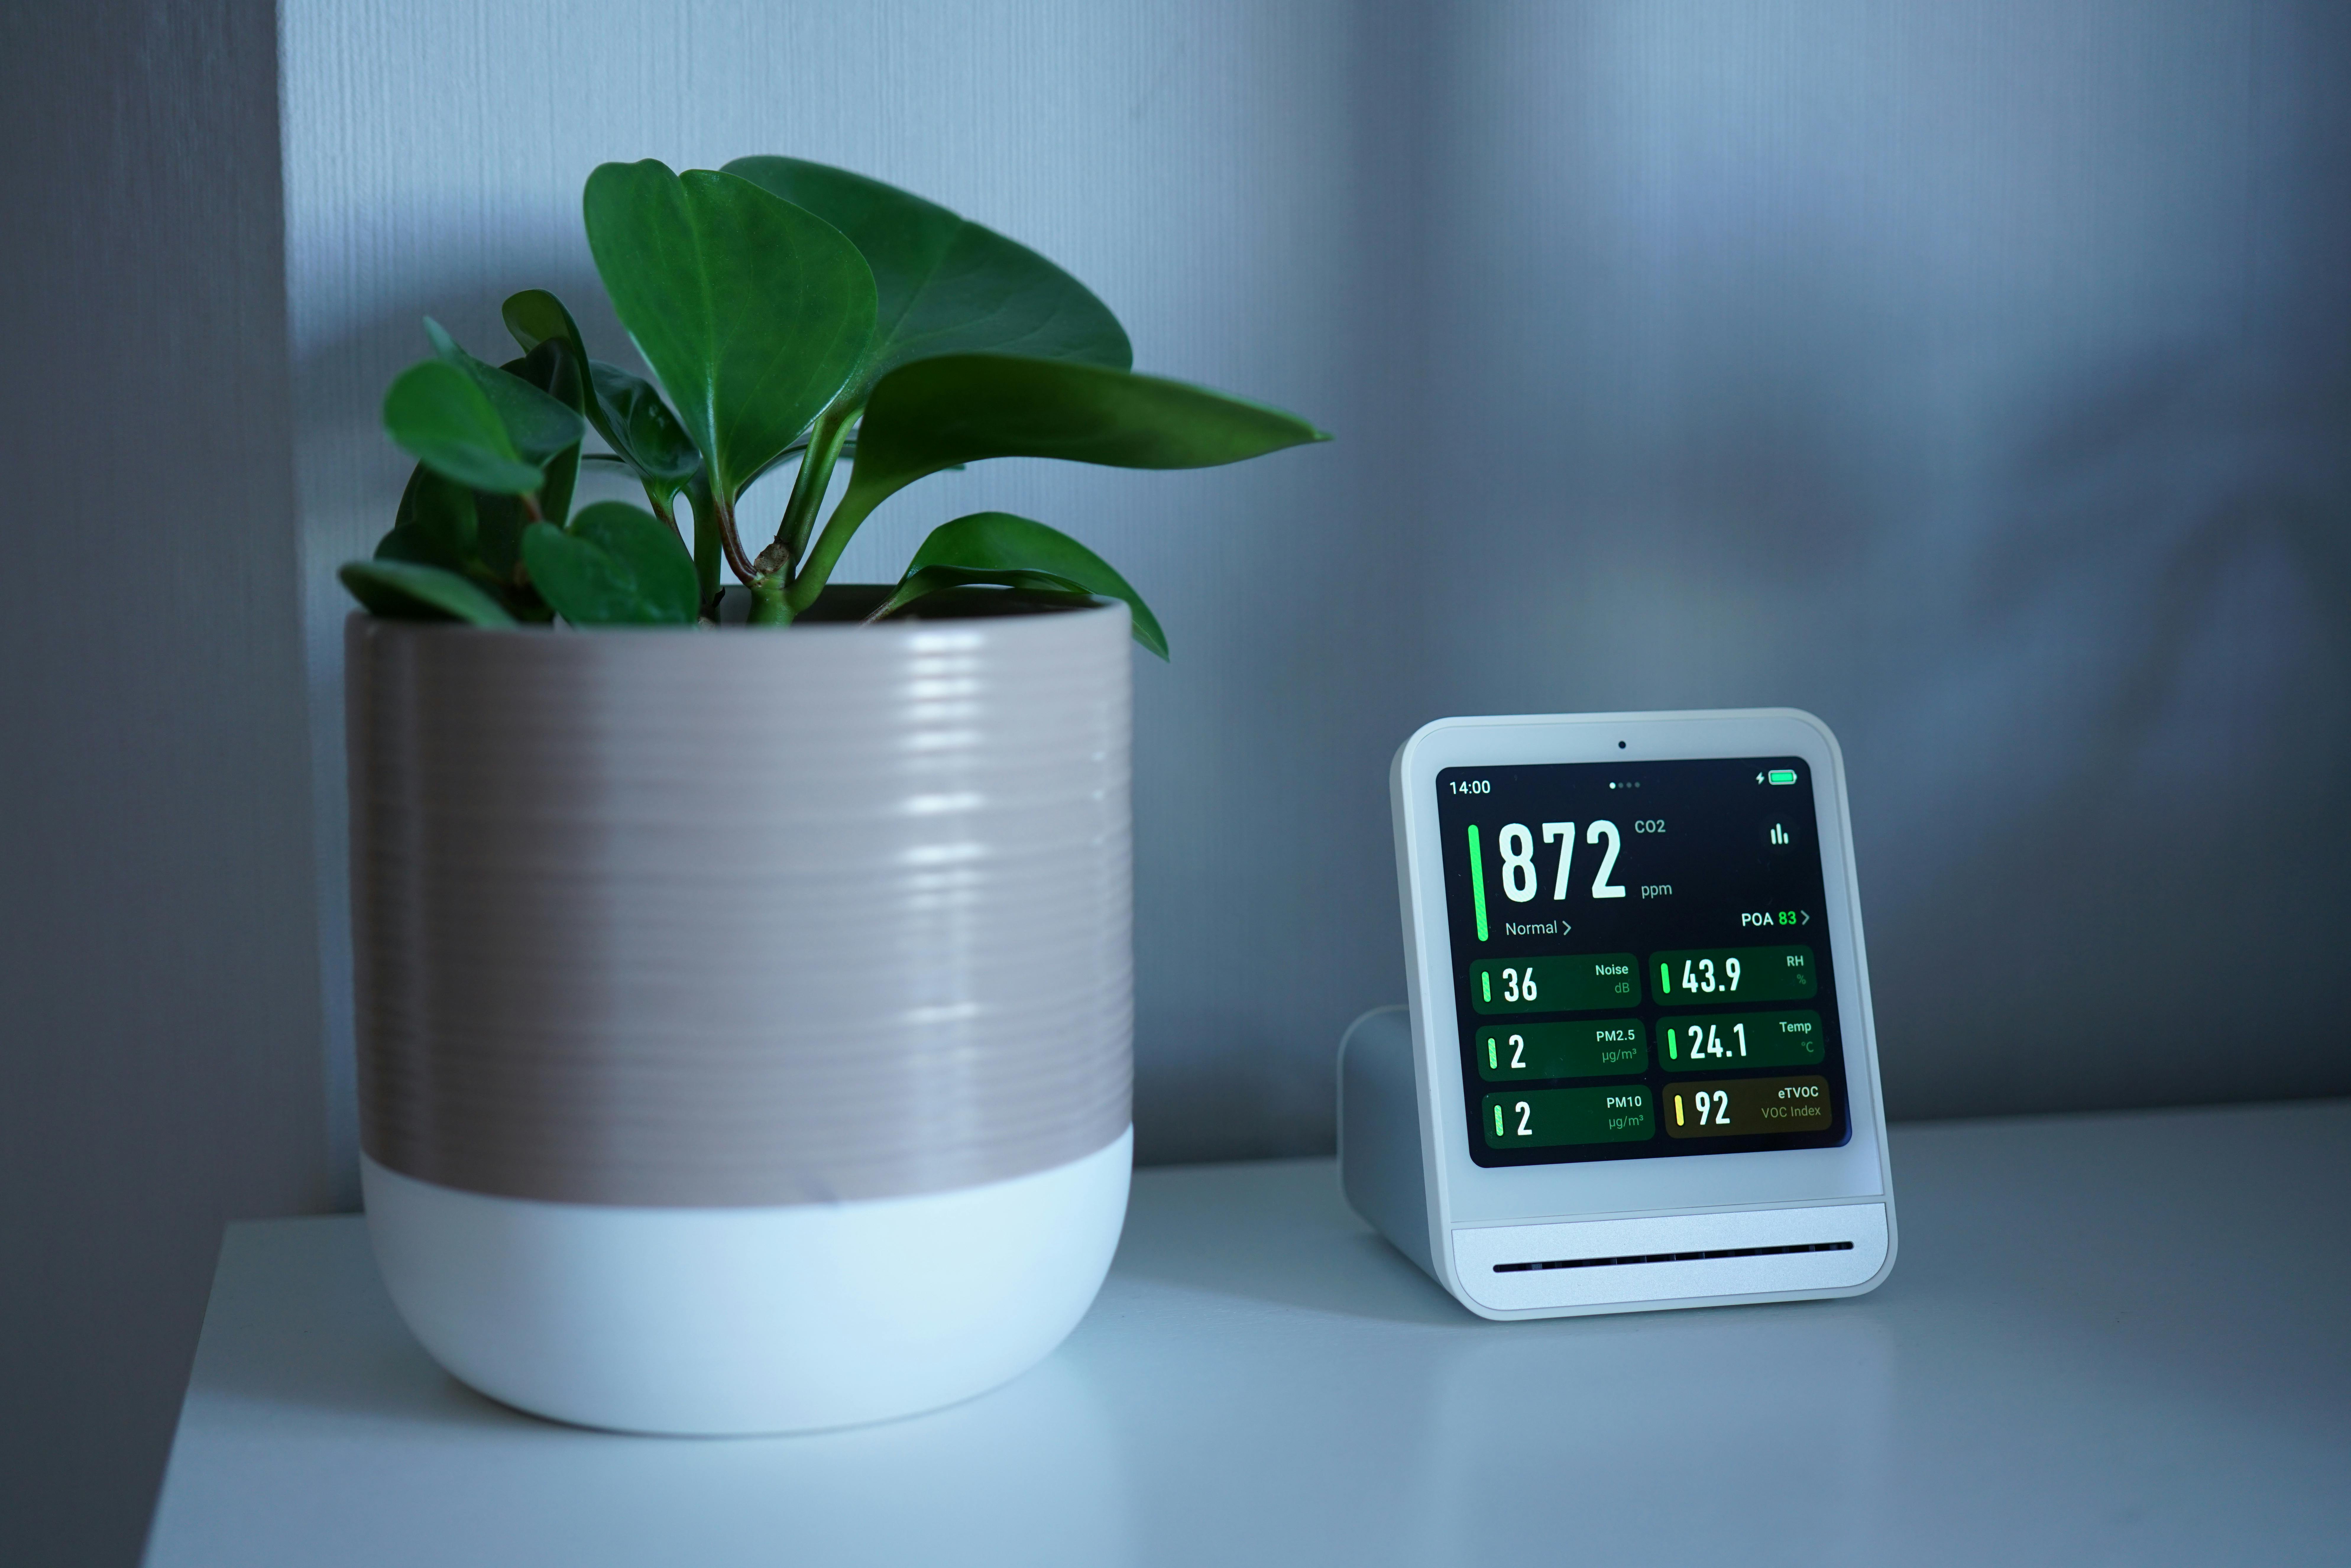
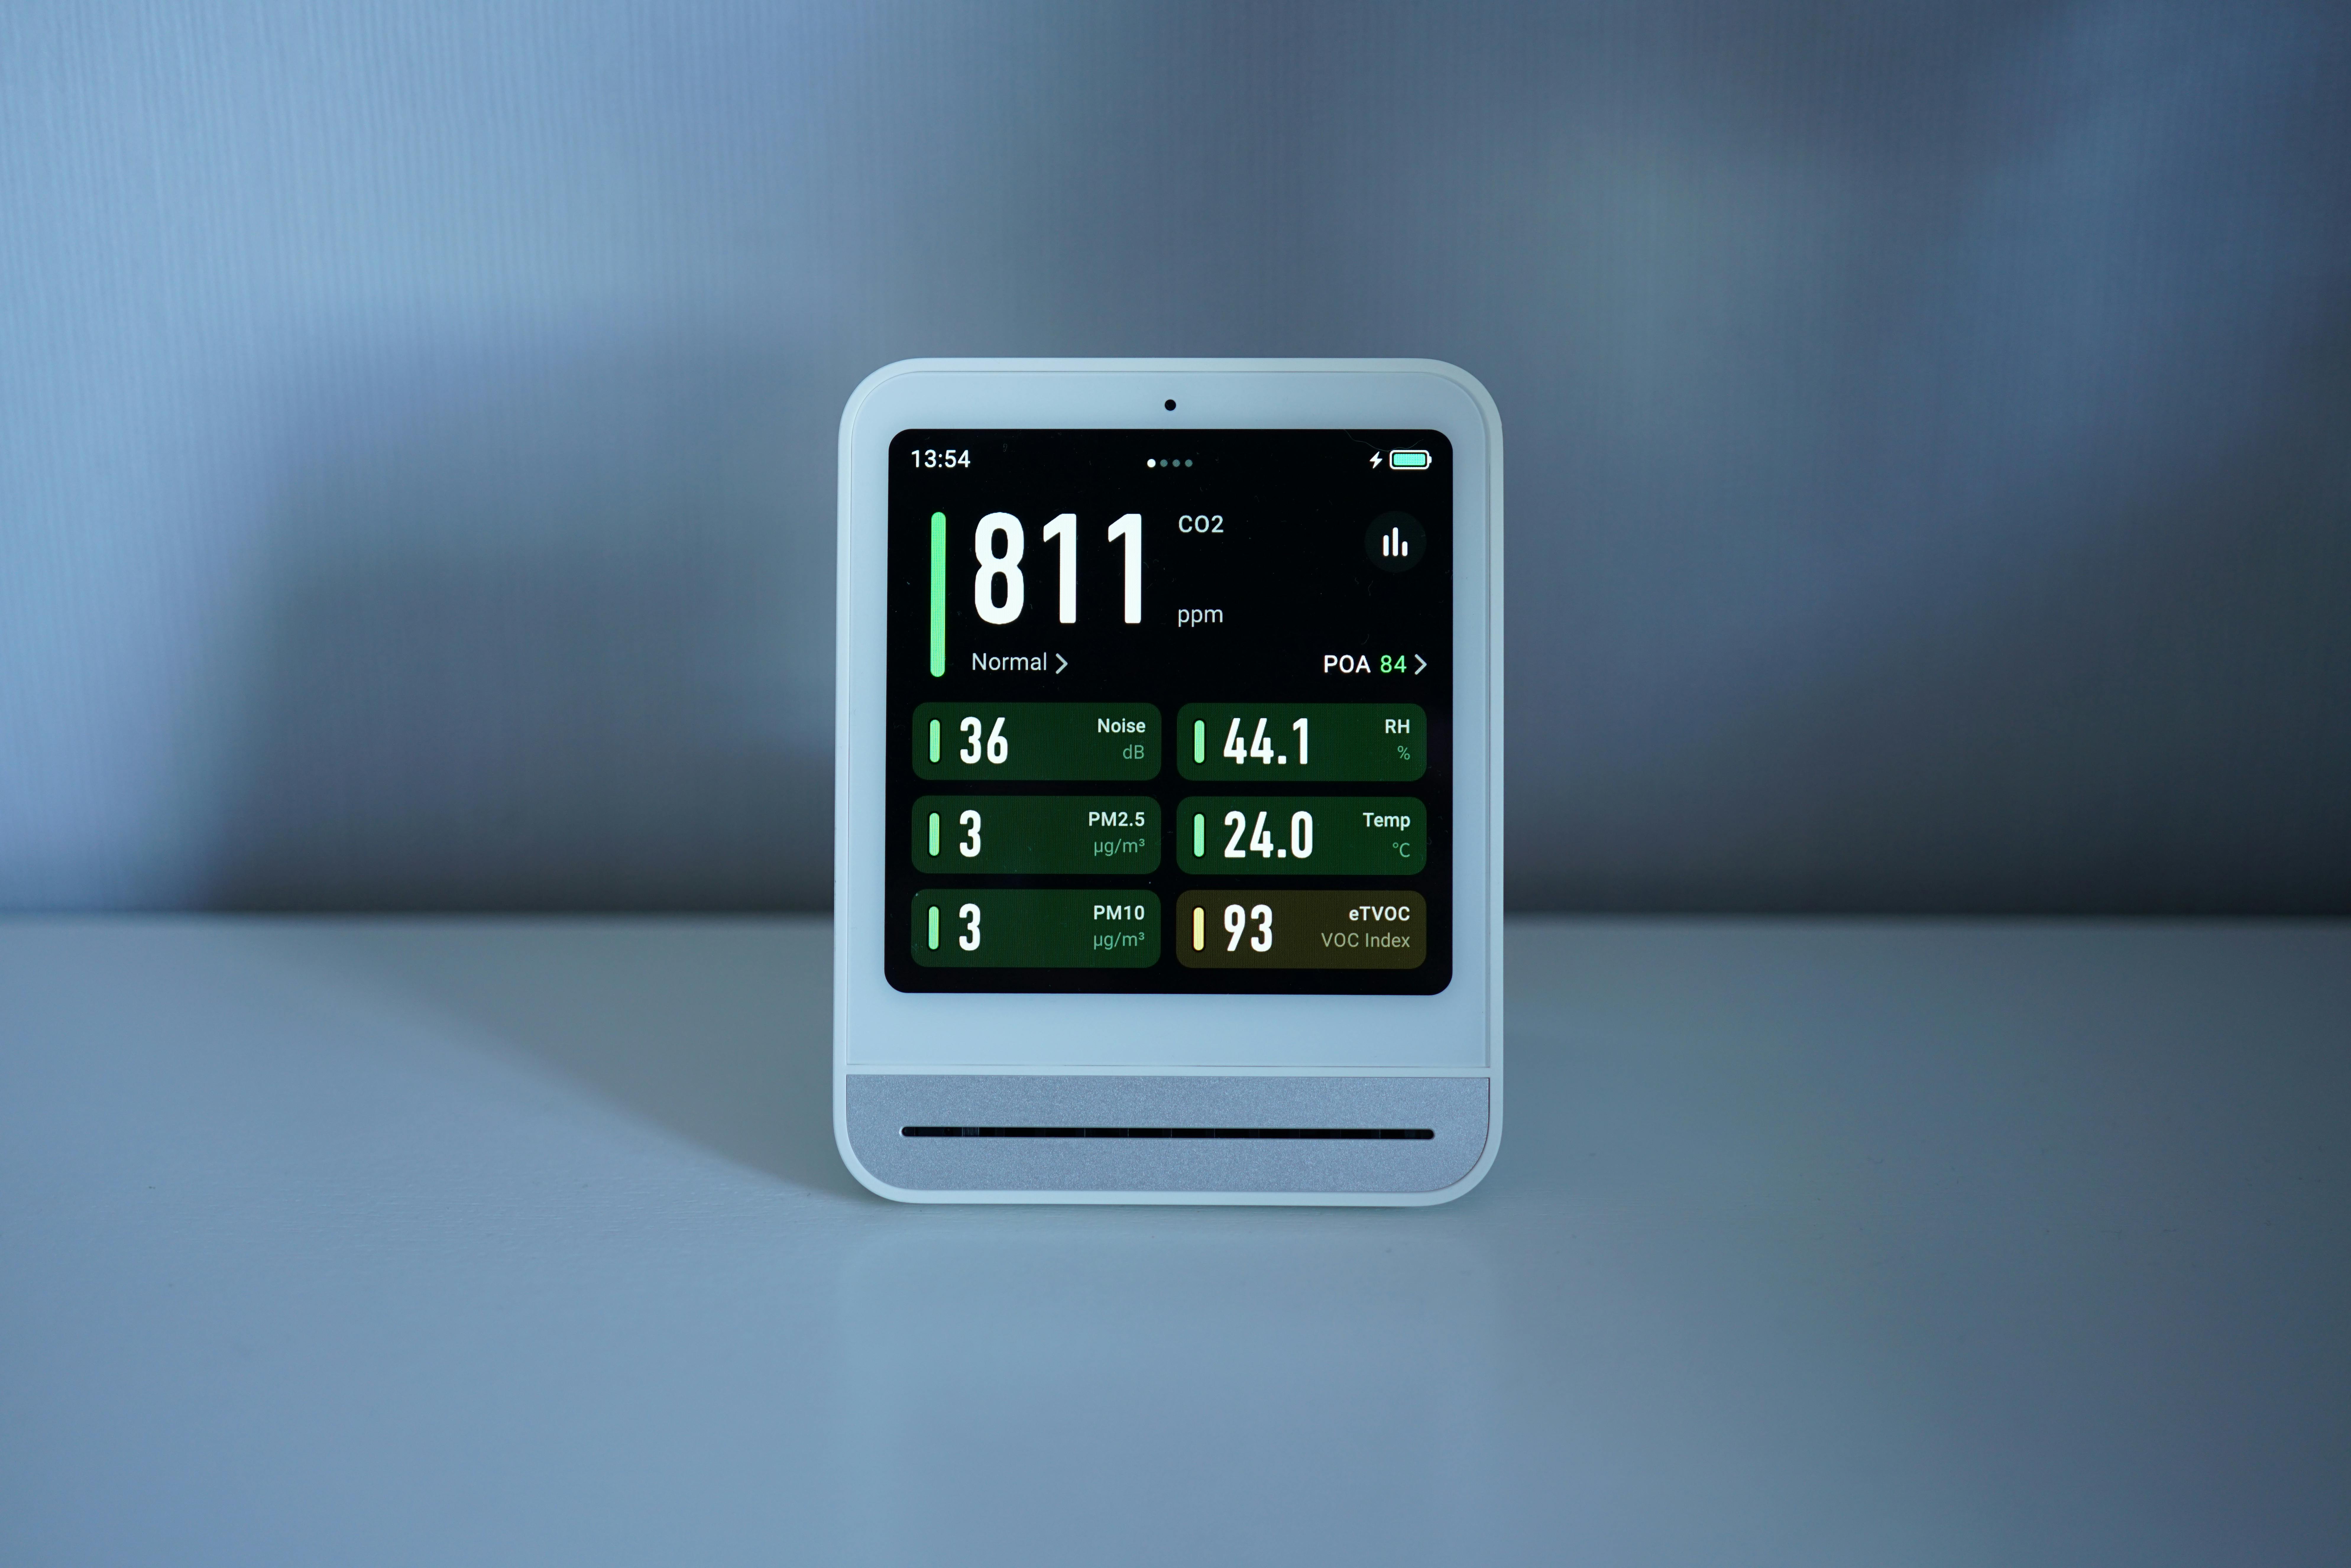
Carbon Dioxide (CO2) Levels
CO2 concentration indicates ventilation effectiveness. While not toxic at typical indoor levels, elevated CO2 suggests insufficient fresh air circulation. Levels above 1000 ppm can cause drowsiness and reduced cognitive function. Proper ventilation keeps CO2 between 400-800 ppm.
Volatile Organic Compounds (VOCs)
VOCs are gases emitted from paints, furniture, cleaning products, air fresheners, and building materials. Short-term exposure causes eye irritation and headaches, while long-term exposure may lead to liver damage and cancer. Total VOC (TVOC) sensors measure combined concentrations.
Temperature and Humidity
These comfort metrics affect perceived air quality and mold growth. Ideal indoor humidity ranges between 30-50%, while comfortable temperatures vary by personal preference but typically fall between 68-72°F (20-22°C).
Essential Components for Your DIY Air Monitor 🛠️
Building an effective air quality monitor requires selecting compatible components that work together seamlessly. Here’s what you’ll need:
Microcontroller Options
The brain of your monitor processes sensor data and communicates results. Popular choices include:
- Arduino Uno or Nano: Beginner-friendly, extensive community support, affordable ($10-25)
- ESP32 or ESP8266: Built-in WiFi for cloud connectivity and smartphone access ($5-15)
- Raspberry Pi Zero W: More powerful, runs full operating systems, ideal for complex displays ($15-35)
Air Quality Sensors
Select sensors based on your primary concerns and budget:
| Sensor | Measures | Approximate Cost |
|---|---|---|
| PMS5003/PMS7003 | PM1.0, PM2.5, PM10 | $15-25 |
| SDS011 | PM2.5, PM10 | $20-30 |
| BME680 | VOCs, temperature, humidity, pressure | $20-35 |
| CCS811 | CO2 (equivalent), TVOC | $10-20 |
| MH-Z19B | CO2 (true NDIR) | $20-30 |
| DHT22 | Temperature, humidity | $5-10 |
Display and Output
Visualizing data makes your monitor practical. Consider these options:
- OLED Display (0.96″ or 1.3″): Compact, clear, low power consumption ($5-15)
- LCD Screen (16×2 or 20×4): Simple, cost-effective character displays ($3-8)
- Smartphone App: Access data remotely through WiFi-enabled microcontrollers
- Web Dashboard: Cloud-based visualization with historical data logging
Additional Materials
Don’t forget these supporting components: breadboard or PCB for prototyping, jumper wires, power supply (USB adapter or battery pack), enclosure (3D printed or project box), and basic tools like wire strippers and a soldering iron.
Step-by-Step Assembly Guide 🔧
Planning Your Build
Start by sketching your sensor layout and deciding which metrics matter most for your environment. A basic setup might include PM2.5 detection and temperature/humidity monitoring, while advanced builds incorporate multiple sensors for comprehensive analysis.
Wiring Your Sensors
Most sensors communicate through I2C, SPI, or UART protocols. Begin with your microcontroller on a breadboard, then connect sensors one at a time, testing each before adding the next. This methodical approach prevents troubleshooting nightmares later.
For I2C sensors like the BME680, you’ll typically connect VCC to 3.3V, GND to ground, SDA to your microcontroller’s data pin, and SCL to the clock pin. UART sensors like the PMS5003 require TX and RX connections for serial communication.
Programming Your Monitor
Download the Arduino IDE or your preferred development environment. Install necessary libraries for each sensor—most manufacturers provide these. Start with example code to verify each sensor works correctly, then integrate them into a unified program.
Your code should read sensor values at regular intervals (typically every 30-60 seconds for PM sensors to preserve their lifespan), process the data, and display or transmit results. Include averaging algorithms to smooth out momentary spikes and provide more reliable readings.
Creating a User Interface
If using a physical display, design a layout that shows critical information at a glance. Rotate between different metrics every few seconds or divide the screen into sections. Color-coded indicators (green for good, yellow for moderate, red for poor) provide immediate visual feedback.
For WiFi-enabled builds, platforms like Blynk, ThingSpeak, or Home Assistant offer ready-made dashboards. These services store historical data, create graphs, and send alerts when thresholds are exceeded.
Calibration and Accuracy Considerations 📊
Consumer-grade sensors aren’t laboratory-precise, but proper calibration improves reliability significantly. Allow new sensors to burn in for 24-48 hours of continuous operation before relying on their readings.
Compare your device against professional monitors or outdoor air quality stations. Many cities publish real-time air quality data that serves as a reference point. Note that indoor conditions differ from outdoor, but PM2.5 sensors should show similar readings when windows are open.
Temperature and humidity sensors benefit from placement away from heat sources, direct sunlight, or air vents. Position your monitor at breathing height (3-5 feet) in commonly occupied rooms for the most relevant data.
Interpreting Your Air Quality Data 📈
Understanding PM2.5 Readings
The EPA Air Quality Index provides guidance: 0-12 μg/m³ is good, 12.1-35.4 is moderate, 35.5-55.4 is unhealthy for sensitive groups, and higher values warrant concern for everyone. Expect spikes during cooking—proper ventilation should return levels to normal within 30 minutes.
CO2 as a Ventilation Indicator
Outdoor CO2 typically measures around 400 ppm. Indoor levels below 800 ppm indicate excellent ventilation, 800-1000 ppm is acceptable, and above 1000 ppm suggests you need more fresh air circulation. Open windows or use mechanical ventilation to reduce elevated levels.
Responding to Poor Air Quality
When your monitor detects problems, take action: increase ventilation by opening windows or using exhaust fans, run HEPA air purifiers, eliminate pollution sources like scented candles or aerosol sprays, and maintain HVAC filters according to manufacturer recommendations.
Advanced Features and Enhancements 🚀
Data Logging and Analysis
Adding an SD card module enables long-term data storage directly on your device. Create CSV files with timestamps and sensor readings to identify patterns—perhaps your air quality deteriorates every evening when cooking, or humidity spikes correlate with mold odors.
Smart Home Integration
Connect your monitor to home automation platforms like Home Assistant, MQTT brokers, or IFTTT. Automatically trigger actions when thresholds are exceeded: turn on air purifiers, adjust smart thermostats, or receive smartphone notifications.
Multi-Room Monitoring
Build multiple monitors and create a mesh network. This reveals how pollutants move through your home—cooking smoke traveling from the kitchen to bedrooms, or basement humidity affecting upper floors.
Weather-Resistant Outdoor Version
Adapt your design for outdoor monitoring by using weatherproof enclosures, solar panels for power, and sensors rated for temperature extremes. Compare indoor and outdoor air quality to optimize window opening schedules.
Troubleshooting Common Issues 🔍
Erratic readings often result from loose connections—double-check all wiring and consider soldering permanent connections. If PM sensors show constant maximum values, they may need cleaning or replacement after accumulating dust internally.
Power supply problems cause random resets or sensor failures. Ensure your power adapter provides sufficient current for all components. WiFi modules like the ESP32 draw significant power during transmission and may require capacitors for stability.
Software bugs usually manifest as frozen displays or nonsensical values. Add serial debugging statements to identify where code fails, and implement watchdog timers that automatically reset the system if it becomes unresponsive.
Maintaining Your DIY Air Monitor 🧹
Laser particle sensors accumulate dust over months of operation, gradually reducing accuracy. Some models like the PMS5003 include self-cleaning fans, but eventually require manual cleaning with compressed air or careful disassembly.
Recalibrate temperature and humidity sensors annually by comparison with trusted reference instruments. Chemical sensors like the BME680 may drift over time and benefit from baseline recalibration in known clean air conditions.
Keep firmware updated if using open-source platforms. Communities constantly improve sensor libraries and fix bugs. Join forums dedicated to air quality monitoring to learn from others’ experiences and discoveries.
The Health Impact of Better Air Awareness 💚
Monitoring alone doesn’t clean your air, but awareness drives behavioral changes. Users report reduced indoor smoking, more frequent ventilation, switching to low-VOC products, and strategic air purifier placement based on actual data rather than guesswork.
Children and elderly family members particularly benefit from improved air quality. Asthma symptoms decrease, sleep quality improves, and cognitive performance increases when CO2 stays below 800 ppm. Your DIY monitor becomes a wellness tool providing measurable health benefits.
Share your findings with neighbors or building management. Apartment dwellers have successfully advocated for improved HVAC maintenance by presenting data showing poor ventilation. Community awareness creates collective action for healthier environments.

Taking Your First Breath of Clean, Monitored Air 🌬️
Building your own indoor air quality monitor transforms invisible environmental hazards into actionable information. With components costing $50-150, you’ll create a customized solution matching commercial devices priced three times higher.
Start simple with a basic PM2.5 and temperature/humidity setup, then expand as your skills and needs grow. The process teaches valuable electronics skills while directly improving your living environment. Every data point empowers smarter decisions about ventilation, cleaning products, and daily activities.
Your lungs deserve the best air possible. By crafting your own monitor, you’re taking control of the environment you spend most of your life in. The journey from components to functioning device mirrors your transformation from passive air breather to informed environmental steward.
Begin gathering components today, and within a weekend, you’ll have a working monitor revealing the invisible world of indoor air quality. Your healthier, cleaner-breathing future starts with that first measurement! 🎯