Precision and accuracy in measurement systems are non-negotiable in modern science, engineering, and quality control. Calibration stands as the cornerstone of reliable instrumentation, and regression methods have emerged as powerful mathematical tools to achieve unparalleled measurement fidelity.
🎯 The Foundation of Calibration in Modern Measurement
Calibration represents the systematic comparison between measurements from an instrument and those made by a reference standard of known accuracy. This fundamental process ensures that instruments provide readings that accurately reflect the true value of what’s being measured. Without proper calibration, even the most sophisticated equipment can produce misleading results that cascade into flawed decisions, failed products, or compromised safety.
The relationship between calibration and regression methods isn’t immediately obvious to many practitioners. However, regression analysis provides the mathematical framework to establish precise relationships between instrument readings and actual values. This connection transforms raw calibration data into actionable correction factors that dramatically improve measurement reliability.
Modern industries from pharmaceutical manufacturing to aerospace engineering depend on calibrated instruments. The consequences of poor calibration range from minor inconveniences to catastrophic failures. Consider medical devices that deliver medication dosages—even small calibration errors can have life-threatening implications. Similarly, manufacturing processes operating with miscalibrated sensors waste resources and produce defective products.
Understanding Regression Analysis as a Calibration Tool
Regression methods establish mathematical relationships between variables by fitting a line or curve through data points. In calibration contexts, these methods connect known reference values to instrument readings, creating a predictive model that corrects future measurements. The beauty of regression lies in its ability to quantify uncertainty while providing best-fit estimates.
Linear regression forms the simplest and most commonly applied regression method in calibration. It assumes a straight-line relationship between reference standards and instrument responses. The equation y = mx + b becomes the calibration curve, where m represents the slope (sensitivity) and b the intercept (offset). This approach works exceptionally well for instruments with linear response characteristics across their operating range.
However, many instruments exhibit non-linear behavior, particularly at extreme ranges. This is where polynomial regression, exponential models, and other advanced techniques become indispensable. These methods accommodate curves, inflection points, and complex response patterns that simple linear models cannot capture accurately.
📊 Building Robust Calibration Curves Through Regression
Creating an effective calibration curve requires careful planning and execution. The process begins with selecting appropriate reference standards that span the instrument’s entire operational range. These standards must have known values with uncertainties significantly lower than the instrument being calibrated—typically by a factor of three to ten.
The number of calibration points directly impacts curve quality. Too few points risk oversimplifying the relationship, while excessive points increase cost and time without proportional benefit. Industry standards generally recommend a minimum of five to seven points for linear calibrations and ten or more for non-linear instruments. Strategic placement of these points matters tremendously, with emphasis on regions where the instrument will be most frequently used.
Data collection methodology influences regression quality profoundly. Multiple readings at each calibration point reduce random error through averaging. Environmental controls ensure temperature, humidity, and other factors remain stable during calibration. Proper instrument warm-up time and settling periods prevent transient effects from contaminating measurements.
Statistical Considerations in Calibration Regression
The coefficient of determination (R²) quantifies how well the regression model fits calibration data. Values approaching 1.0 indicate excellent fit, while lower values suggest poor model appropriateness or problematic data. However, R² alone doesn’t tell the complete story—residual analysis provides crucial insights into model adequacy.
Residuals represent differences between actual measurements and values predicted by the regression model. Plotting residuals reveals patterns that indicate model deficiencies. Random scatter around zero suggests good model fit, while systematic patterns indicate the need for alternative regression approaches or investigation of measurement problems.
Uncertainty propagation through regression models ensures realistic assessment of measurement confidence. The uncertainty in calibrated measurements combines uncertainties from reference standards, instrument repeatability, and regression model fitting. Proper uncertainty quantification separates professional calibration from amateur approximation.
⚙️ Advanced Regression Techniques for Complex Calibration Challenges
Weighted regression accommodates situations where measurement uncertainty varies across the calibration range. Traditional ordinary least squares regression treats all points equally, but weighted approaches assign greater importance to more precise measurements. This proves particularly valuable when reference standards have different uncertainty levels or when instrument precision varies with signal magnitude.
Multivariate regression extends calibration beyond simple one-to-one relationships. Some instruments require correction based on multiple influencing factors like temperature, pressure, or aging effects. Multiple linear regression and more sophisticated techniques like principal component regression handle these multidimensional calibration challenges elegantly.
Robust regression methods resist the influence of outliers that can skew traditional least-squares fits. Laboratory calibrations occasionally produce anomalous data points due to procedural errors or unexpected disturbances. Robust techniques automatically downweight these outliers, producing more reliable calibration curves without manual data editing.
Implementing Calibration Regression in Practice
Software tools have democratized sophisticated regression analysis for calibration applications. Spreadsheet programs offer basic regression capabilities sufficient for straightforward linear calibrations. Statistical packages like R, Python with SciPy, and commercial solutions provide advanced techniques for complex scenarios.
Documentation forms an essential but often neglected aspect of calibration practice. Complete records must capture reference standard certifications, environmental conditions, raw data, regression equations, uncertainty budgets, and analyst identifications. This traceability ensures audibility and enables future troubleshooting when measurement questions arise.
Calibration intervals determine how frequently instruments require recalibration. Statistical process control applied to calibration history data optimizes these intervals. Instruments with stable calibration curves can often extend intervals safely, while problematic units require more frequent attention. Regression drift analysis quantifies how quickly calibration parameters change over time.
Quality Indicators for Calibration Success
Several metrics help evaluate calibration effectiveness. Span error measures the difference between instrument reading and true value at full scale. Zero error quantifies offset at the low end of the range. Linearity error describes maximum deviation from the best-fit straight line across the operating range. These parameters translated through regression analysis guide adjustment and acceptance decisions.
Calibration guards bands account for measurement uncertainty by tightening acceptance criteria. Rather than accepting instruments that barely meet specifications, guard bands provide safety margins ensuring high confidence that calibrated instruments actually meet requirements. Regression-derived uncertainties inform appropriate guard band widths.
🔬 Industry-Specific Calibration Applications
Pharmaceutical manufacturing operates under stringent regulatory frameworks requiring validated calibration procedures. Temperature mapping studies for stability chambers, analytical balance calibrations, and chromatography system qualifications all leverage regression methods. Documentation requirements exceed most industries, with complete traceability to national standards mandatory.
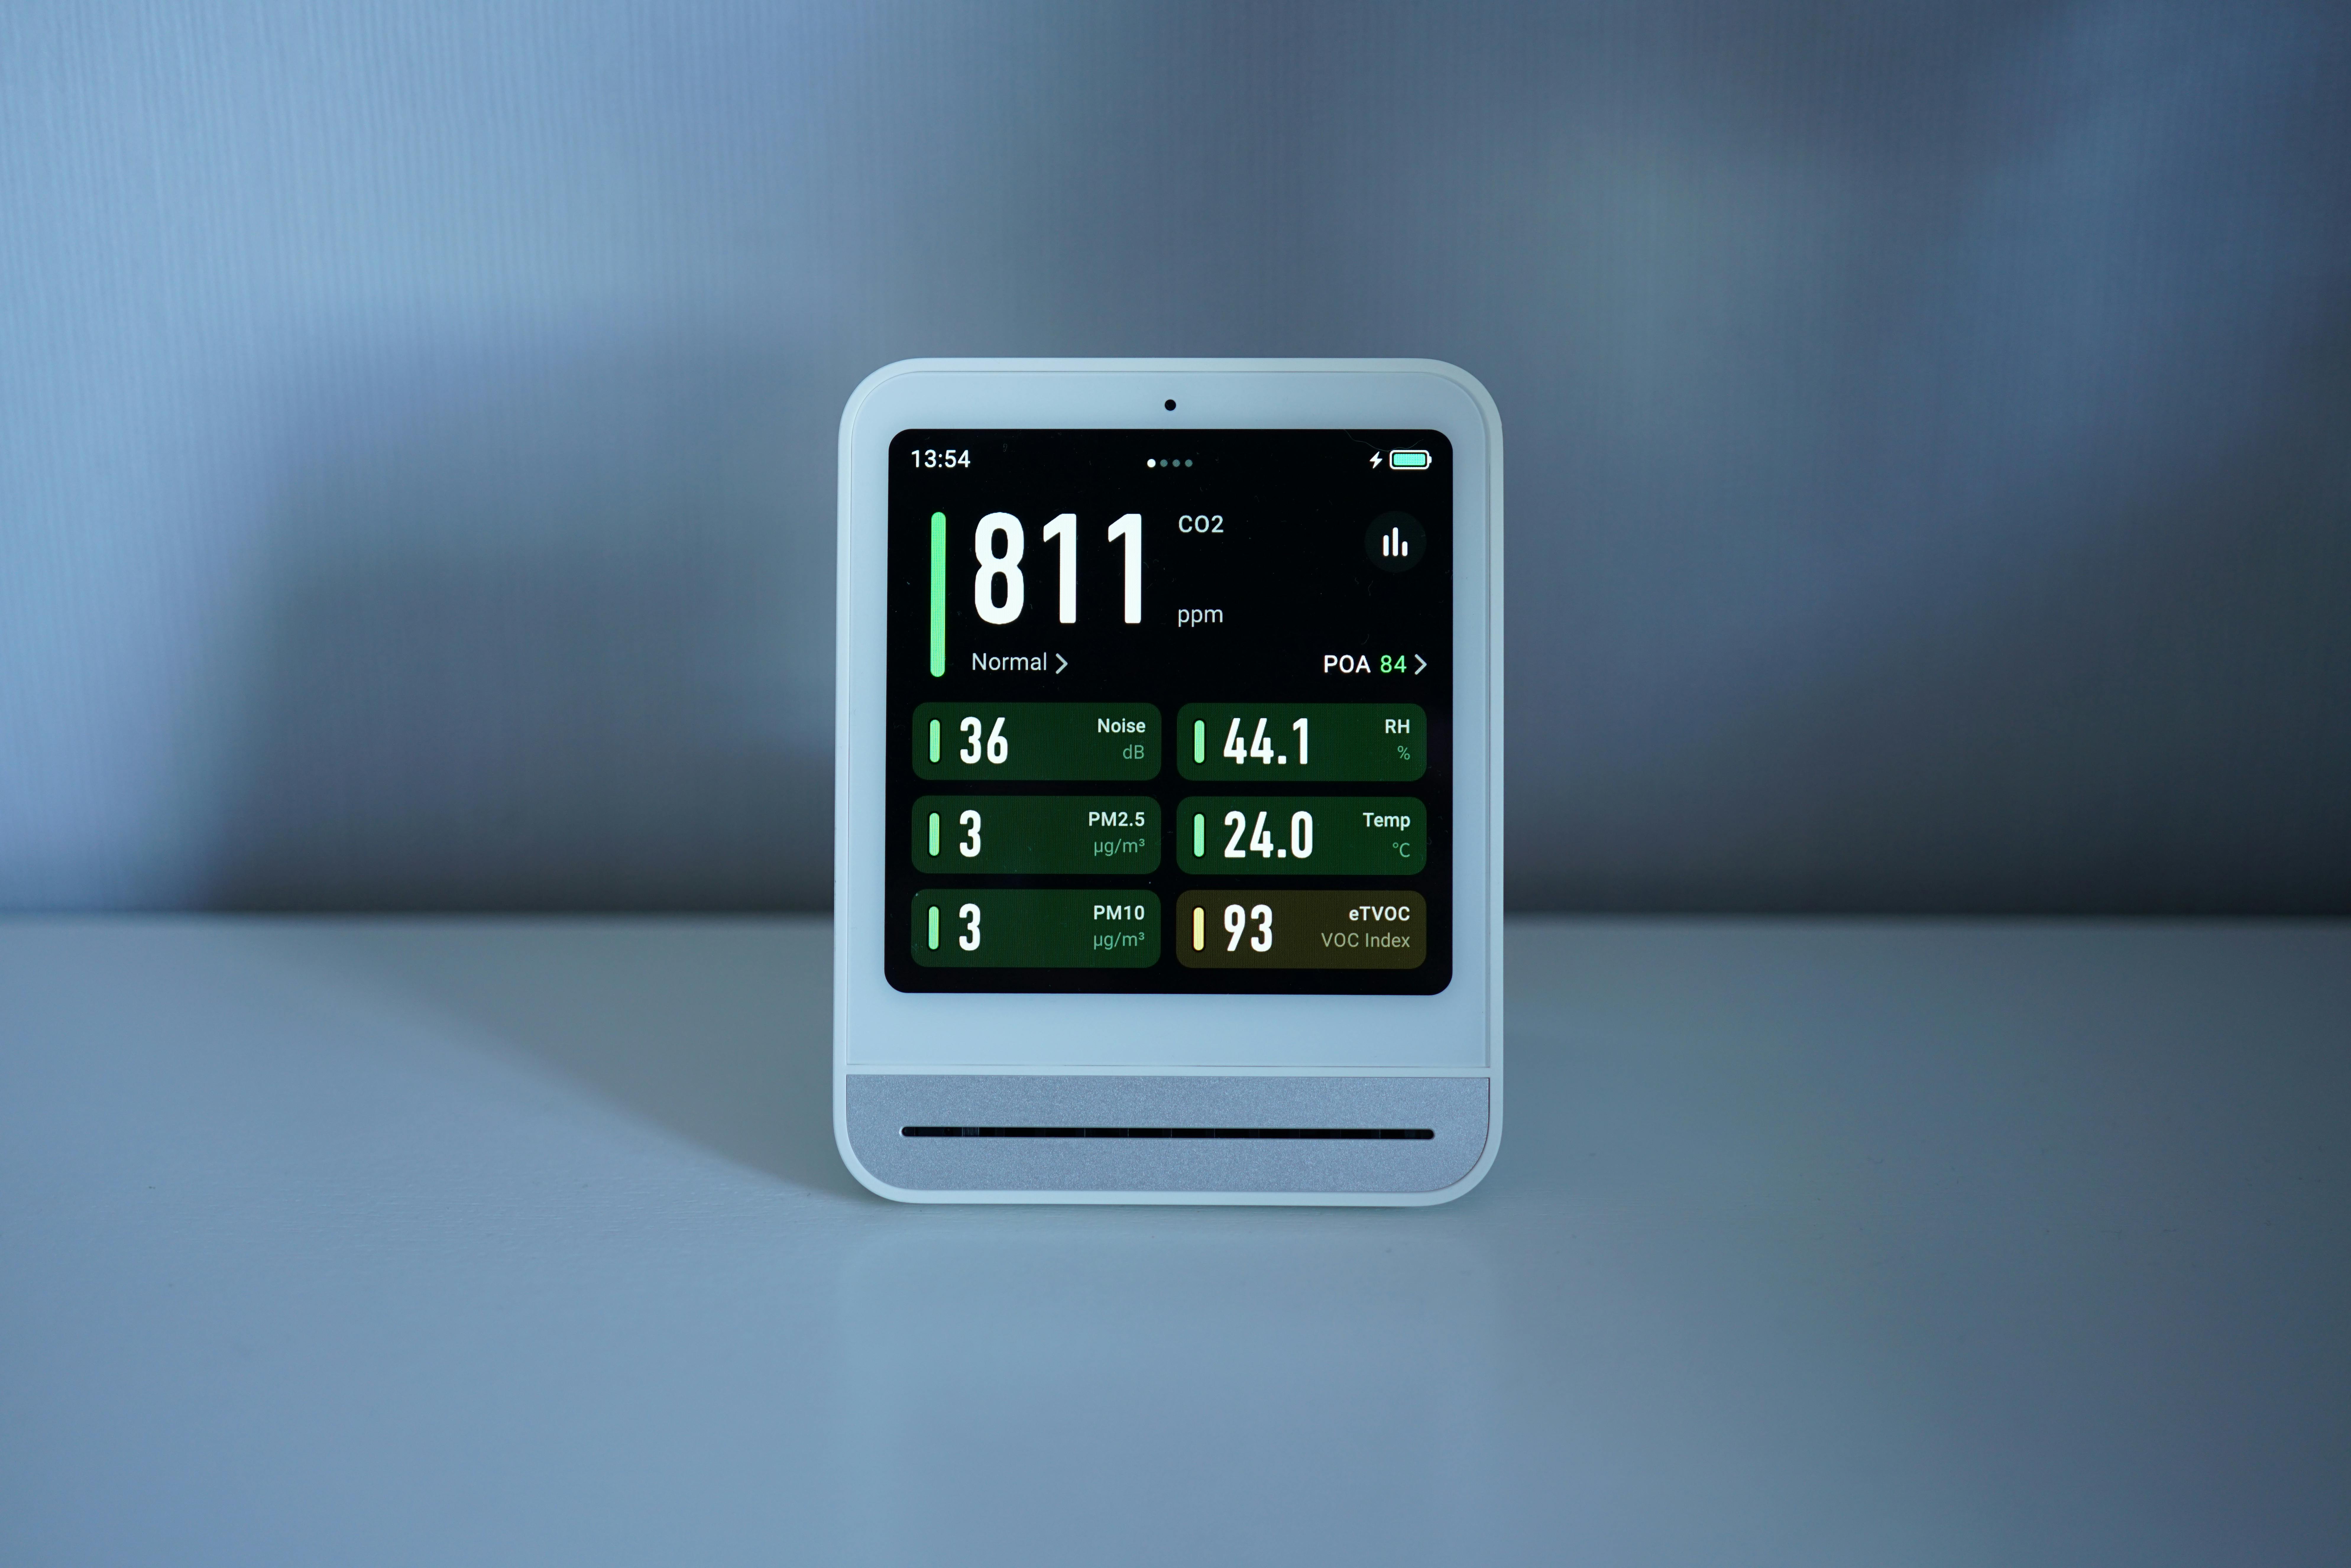
Environmental monitoring relies on calibrated sensors for air quality, water purity, and emission controls. These applications often face challenging conditions with fouling, drift, and interference issues. Frequent calibration checks using regression-verified curves ensure data reliability for regulatory compliance and public health protection.
Manufacturing process control demands calibrated instrumentation for temperature, pressure, flow, and composition measurements. Statistical process control charts become meaningless without calibrated sensors. Regression-based calibration ensures that process data accurately reflects reality, enabling optimization and quality assurance.
Common Pitfalls and How to Avoid Them
Extrapolation beyond calibrated ranges represents a frequent and dangerous error. Regression models predict relationships within the data range used for fitting but often fail dramatically outside those bounds. Responsible practitioners restrict instrument use to calibrated ranges or perform additional calibrations to extend coverage.
Ignoring regression assumptions causes subtle but serious problems. Linear regression assumes random, normally distributed errors with constant variance. Violating these assumptions produces misleading uncertainty estimates and potentially biased calibration curves. Diagnostic plots and statistical tests verify assumption validity before trusting regression results.
Inadequate reference standard uncertainty undermines the entire calibration process. Standards must be traceable to national metrology institutes through unbroken chains of calibrations. Expired certifications, inappropriate standard selection, or insufficient accuracy margins all compromise calibration validity regardless of regression sophistication.
💡 Emerging Trends in Calibration Technology
Machine learning algorithms increasingly supplement traditional regression methods for complex calibration challenges. Neural networks and support vector machines can model highly non-linear instrument responses that defy conventional mathematical description. These approaches require larger datasets but offer superior prediction in exchange.
Automated calibration systems integrate robots, software, and environmental chambers to perform calibrations with minimal human intervention. These systems execute regression calculations in real-time, adjusting instrument parameters automatically and documenting results. Labor savings and consistency improvements make automation attractive for high-volume calibration laboratories.
Cloud-based calibration management platforms centralize data from multiple locations, enabling enterprise-wide visibility and analysis. Regression trending across instrument fleets identifies problematic models, predicts failure modes, and optimizes calibration schedules. Big data analytics applied to calibration records unlock insights impossible from individual instrument histories.
Building Calibration Competency Within Organizations
Training programs must balance theoretical understanding with practical skills. Technicians need to comprehend regression fundamentals without necessarily mastering mathematical derivations. Hands-on practice with real instruments, reference standards, and software tools builds confidence and competence. Regular refresher training prevents skill degradation and introduces new techniques.
Procedure development requires collaboration between technical experts and quality systems personnel. Effective calibration procedures specify equipment, standards, environmental requirements, acceptance criteria, and regression methods clearly. Procedures must be detailed enough to ensure consistency yet flexible enough to accommodate legitimate variations.
Continuous improvement processes identify and address calibration system weaknesses systematically. Audit findings, customer complaints, and internal quality metrics highlight opportunities. Root cause analysis determines whether problems stem from inadequate procedures, insufficient training, equipment limitations, or other factors. Corrective actions targeting root causes produce lasting improvements.
🎓 Maximizing Value From Calibration Investments
The cost-benefit equation for calibration extends beyond compliance obligations. Properly calibrated instruments reduce waste by catching process deviations early, improve product quality through tighter control, and minimize liability exposure from measurement-related failures. Regression methods maximize these benefits by extracting maximum precision from calibration data.
Risk-based calibration approaches allocate resources according to measurement criticality. Low-risk measurements may accept simplified calibration schemes, while critical measurements warrant intensive efforts including advanced regression techniques, frequent intervals, and rigorous uncertainty analysis. This prioritization optimizes calibration effectiveness within budget constraints.
Integration between calibration management and other quality systems creates synergies. Linking calibration data with process control charts, product test results, and customer feedback reveals relationships between measurement quality and business outcomes. These connections justify calibration investments and guide improvement priorities with objective evidence.
Transforming Calibration From Cost Center to Strategic Asset
Organizations that view calibration merely as regulatory obligation miss tremendous opportunities. Measurement excellence enables innovation by providing reliable data for research and development. It facilitates process optimization by revealing subtle relationships between variables. It strengthens customer confidence through demonstrated quality commitments. Regression-based calibration methods provide the precision foundation supporting these strategic advantages.
The journey toward calibration mastery requires commitment to continuous learning, investment in proper tools and standards, and cultural appreciation for measurement quality. Organizations that embrace these principles transform their calibration functions from necessary expenses into competitive differentiators. The mathematical rigor of regression methods ensures this transformation rests on solid technical ground rather than wishful thinking.
Precision and accuracy aren’t abstract ideals but practical business requirements. Every measurement carries consequences—some immediate and obvious, others subtle and long-term. Mastering calibration through regression methods equips professionals with tools to minimize measurement uncertainty, quantify remaining risks, and make informed decisions based on reliable data. This capability increasingly separates successful organizations from those struggling with quality problems in our measurement-dependent world.